There’s a lot of talk about how easy it is to setup a statically-generated blog (such as this!) using a static site generator and hosting it on Github pages.
In this post, we’ll take a look at a simple git workflow that can be used to manage a statically-generated site, such as this.
Github pages usually publish the content from the master branch of a git repo, and while some tips found online might suggest keeping the generated content and the source material in separate repos, it’s easier to have them all in one project that can be managed all at the same time.
For the rest of this post, we’ll use the examplepage repo as an example. and assume we’ll be using the Hugo blog generator.
Basic Setup
We’ll first setup a new repo on Github to host the site. In this example, we’re using https://github.com/ruiwen/examplepage.github.io.
With that done, we can begin to setup our project directory. hugo provides a quick way to get started with that
$ hugo new site -f yaml examplepage.github.io
Congratulations! Your new Hugo site is created in /home/ruiwen/projects/examplepage.github.io.

Just a few more steps and you're ready to go:

1. Download a theme into the same-named folder.
   Choose a theme from https://themes.gohugo.io/, or
   create your own with the "hugo new theme <THEMENAME>" command.
2. Perhaps you want to add some content. You can add single files
   with "hugo new <SECTIONNAME>/<FILENAME>.<FORMAT>".
3. Start the built-in live server via "hugo server".

Visit https://gohugo.io/ for quickstart guide and full documentation.


$ ls examplepage.github.io/
archetypes  config.yaml  content  data  layouts  static  themes
We use the -f yaml option to specify that we’d like to use YAML as a configuration format. hugo defaults to TOML by default.
To get started, you’ll need to configure hugo, setting values for the baseURL, and title of the site, but that’s beyond the scope of this blog post.
For now, let’s also create a simple blog post.
$ hugo new post/a-sample-post.md
/home/ruiwen/projects/examplepage.github.io/content/post/a-sample-post.md created
You’ll notice that new content is rooted at the content/ directory, and all we need to do is to specify the path under that, eg. post/a-sample-post.md.
We’ll also add some content to the new post.
$ echo "Here's a sample post! Welcome to our sample page!" >> content/post/a-sample-post.md
$ cat content/posts/a-sample-post.md
---
title: "A Sample Post"
date: 2018-05-29T17:57:14+08:00
draft: true
---

Here's a sample post! Welcome to our sample page!
First, we want to create an initial empty commit. This will be our repo’s starting point, and allow us to manage two different aspects of the site in the same repo.
We’ll want to create a new branch, that is notmaster. For this example, we use source
$ git checkout -b source
Switched to a new branch 'source'
Then we add all the files
$ git add .
$ git commit -m "New post: A sample post"
[source 2f14616] New post: A sample post
4 files changed, 21 insertions(+)
create mode 100644 archetypes/default.md
create mode 100644 config.yaml
create mode 100644 content/post/a-sample-post.md
create mode 160000 themes/hyde-hyde
$ git log --oneline --graph --decorate --all
* 2f14616 New post: A sample post  (HEAD -> source) [Ruiwen Chua 1 second ago]
* d9c0248 Initial empty commit  (master) [Ruiwen Chua 60 seconds ago]
We see that the source files have been committed to the source branch.
Now, because Github pages deploys content from the master branch, we want a) the fully rendered static files to reside in the master branch, and b) none of the source files to reside in the master branch. Hugo renders to public/ by default, so we’ll want make sure that our public/ directory represents our master branch.
Setting public/ as our master branch
We’ll first make public/ the home of our master branch. git has a wonderful tool that allows us to checkout a branch into its own directory that resides right alongside the rest of the repo. We’ll use git worktree to make this happen.
$ git worktree add -b master public
Preparing public (identifier public)
HEAD is now at d9c0248 Initial empty commit
The interesting thing about git worktree is that it allows us to check out a completely different branch of the repo and have it checked out alongside any other branch we happen to be working on.
$ cd public
$ ls
$ git branch
* master
  source
In the public/ directory, we don’t see any files in the listing, because the master branch is currently pointing at our original empty commit. However, we do see that git recognises that we are, in fact, in the master branch, and not the source branch, where we were previously.
Now that public/ represents our master branch, we’re going to get hugo to render our site into it.
$ hugo
                   | EN
+------------------+----+
  Pages            |  7
  Paginator pages  |  0
  Non-page files   |  0
  Static files     |  8
  Processed images |  0
  Aliases          |  0
  Sitemaps         |  1
  Cleaned          |  0

Total in 239 ms
$ ls public/
404.html  apple-touch-icon-144-precomposed.png  categories  css  favicon.png  img  index.html  index.xml  sitemap.xml  tags
$ cd public
$ git status
On branch master
Untracked files:
  (use "git add <file>..." to include in what will be committed)

        404.html
        apple-touch-icon-144-precomposed.png
        categories/
        css/
        favicon.png
        img/
        index.html
        index.xml
        sitemap.xml
        tags/

nothing added to commit but untracked files present (use "git add" to track)
We’ll just commit the files in public/, and they should be added to our master branch
Now we see that the rendered site under public/ has been committed to the master branch, while the source material still remain on the source branch. Both branches branch from the initial empty commit we made, and both branches can exist simultaneously in the same working environment, thanks to git worktree. This suits hugo’s publishing workflow pretty well, allowing us to render straight into our master branch for committing.
When setting up a Kubernetes cluster, a Prometheus and Grafana setup is a great way to have to start monitoring your cluster health. From CPU and RAM stats, to filesystem usage, to even the number and type of requests that your cluster is serving. One thing however, is that most setups tend to assume that you’ll be deploying Prometheus within the cluster itself. To be sure, this is probably the easier way of settings things up. Within the cluster, your Prometheus set up will have no issues finding and monitoring the configured pods, endpoints and nodes.
The Problem with an out-cluster Prometheus setup
That said, sometimes, it’s not entirely feasible to deploy Prometheus within a particular cluster — for example, if you wanted Prometheus to monitor mulitple Kubernetes clusters across multiple service providers like AWS and Azure.
In this scenario, I’ve found it more convenient to host Prometheus separately, outside the Kubernetes clusters, then set it up to monitor the clusters and their services and pods.
However, I ran into yet another problem, which was properly exposing the services to have them scaped by Prometheus — particularly in the case of Deployments that spanned more than one Pod. While I could potentially include sidecar containers in each Pod exposing /metrics on a given port, I struggled to find a way to properly expose them to an out-cluster Prometheus. I could expose an Ingress and have Prometheus access the endpoint through the cluster’s main IP, but given as how Kubernetes Services deliver requests to their backing Pods in a round-robin fashion, this meant that each successive scrape could end up hitting a different pod. This would lead to confusing metrics to say the least. Ideally, what we would want is for Prometheus to be able to distinguish between the metrics scraped from each individual pod (with a different label for each pod), that way, we could tell if, say, one Pod ended up serving more traffic than the others in the Deployment.
One option to address each Pod individually would perhaps be to expose one Ingress per Pod. Of course, this would have to be automated in some form, perhaps having yet another Service watch new pods being spun up and creating the necessary exporters and Ingresses automatically, but this approach quickly gets very unwieldy, without even considering what happens once we start scaling in any form.
So now we have two problems. We want to
have Prometheus be able to access the metrics endpoints for all necessary pods, without the need to have to define them beforehand,
and do so from outside the cluster, without having to manually (or otherwise) open up Ingresses
Abusing the API Server
As it turns out, the APIServer does in fact allow us to communicate directly with the Pods, without necessarily creating an Ingress, or a Service beforehand. All that’s needed is the proper credentials and authorisation to make HTTP requests through the APIServer.
It’s not terribly obvious from the outset, but even the very familiar kubectl does in fact communicate with the APIServer (and manages the cluster) via simple HTTP calls. (Run any kubectl command with the -v 10 option to see the HTTP calls that are being made in the background — eg. kubectl -v 10 version)
Access Control
In order to communicate with the APIServer through its API though, we’ll first need to set up some form of access control.
If you’re on Kubernetes < 1.6, you’ll have to use Attributed-based Access Control (ABAC), and if you’re running Kubernetes > 1.6, you’ll be able to use the more convenient Role-based Access Control (RBAC). A discussion on how to effectively use ABAC vs RBAC is beyond the scope of this post, but essentially, you’ll want to end up with an access token (eg. a ServiceAccount’s Secret token value) that will allow you to make authenticated and authorised requests to the APIServer.
If you’d just like to try it out, you could run kubectl -v 10 version, watch the HTTP calls, and simply use the values kubectl is sending in the Authorization HTTP header. For production setups however, I’d recommend setting up a proper ServiceAccount with appropriately scoped permissions.
Accessing Pods through the APIServer
It’s not commonly mentioned in the general Kubernetes documentation, but APIServer does allow you to make rquests directly to the pods within the cluster.
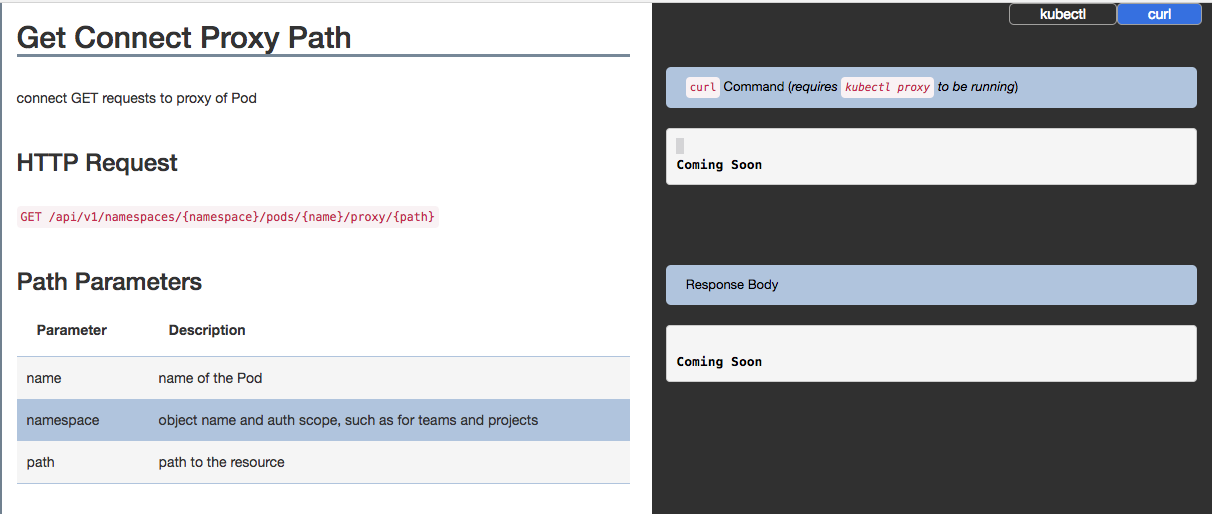
Get Connect Proxy Path
It's hardly clear what you're supposed to do with this, and the lack of documented examples don't help either
However, with the handy documentation on this page, we can make HTTP calls directly to each pod, through the Kubernetes API server, without needing to create a specific Ingress for each Pod that we’d like to have Prometheus scrape. It follows that this means that we can afford to then expose metrics pages only on cluster-local IP addresses, without worry of those pages leaking out to the public Internet.
From the Kubernetes API documentation, we can refer to the sections on Proxy operations for the various Kubernetes objects. For example, the Pod proxy operations show us how to reach out to a specific Pod through the Kubernetes API.
Assuming we have a Prometheus exporter pod, prom-exporter in the namespace monitoring, that exposes metrics at the path /metrics, that we’d like to scrape.
The general pattern of the request looks like
GET /api/v1/proxy/namespaces/{namespace}/pods/{name}/{path}
We can make a request to the Pod via the call below
GET /api/v1/proxy/namespaces/monitoring/pods/prom-exporter/metrics
#
# As a curl command, it should look something like
#
# $ curl "https://<api_server:port>/api/v1/proxy/namespaces/monitoring/pods/prom-exporter/metrics
which should give us our exported metrics.
Security
Naturally, when you’re setting up Prometheus to perform scraping through the proxy API in this manner, you’ll want to be connecting over HTTPS to ensure that your metrics are not leaked to third parties over the wire. However though, since Kubernetes APIServer SSL certs are usually self signed, you’ll also want to include your APIServer’s CA certificate in your Prometheus configuration so that you can authenticate the server.
The important bit is between the BEGIN CERTIFICATE and END CERTIFICATE lines, inclusive. Save that to a file named ca.crt (for example), and include it in your prometheus.yml.
Putting it together
Eventually, our configuration ends up looking something like this
    ...
    - job_name: 'natsd'
      scheme: https
      bearer_token: "$KUBERNETES_TOKEN"
      tls_config:
        ca_file: /etc/prometheus/tls/certs/kubernetes.crt

      kubernetes_sd_configs:
      - api_server: 'host.kubernetes.apiserver.com'
        bearer_token: "$KUBERNETES_TOKEN"
        tls_config:
          ca_file: /etc/prometheus/tls/certs/kubernetes.crt
        role: pod

      # Tells Prometheus to query the APIServer for all pods matching the target label (natsd-*) below
      # and for each of the pods, generate a scrape target at the `/metrics` path via the proxy API
      relabel_configs:
      - source_labels: [__meta_kubernetes_namespace, __meta_kubernetes_pod_name, __meta_kubernetes_pod_container_port_name]
        action: keep
        regex: default;natsd-.*;metrics  # Remember to use the right 'container_port_name` as specified in the Deployment
      - target_label: __address__
        replacement: 'host.kubernetes.apiserver.com'  # API server address
      - source_labels: [__meta_kubernetes_namespace, __meta_kubernetes_pod_name,__meta_kubernetes_pod_container_port_number]
        regex: (.+);(.+);(.+)
        target_label: __metrics_path__
        replacement: /api/v1/namespaces/${1}/pods/http:${2}:${3}/proxy/metrics  # Path after /proxy/ is metrics path of pod
      - action: labelmap
        regex: __meta_kubernetes_pod_label_(service|tier|type)
      - source_labels: [__meta_kubernetes_namespace]
        action: replace
        target_label: namespace
      - source_labels: [__meta_kubernetes_pod_name]
        action: replace
        target_label: pod_name
    ...
With this, we can expose metrics on each individual natsd-* pod within the Kubernetes cluster, without needing to worry about setting up an Ingress nor a Service for the sole purpose of allowing an off-cluster Prometheus setup to access said metrics.
Kubernetes for small Organisations: Is it worth it?
I recently gave a talk at GeekcampSG 2016 about our ongoing experience with Kubernetes in Lomotif.
It wasn’t a technical deep-dive, so I didn’t talk very much about the implementation itself, but more about the experience in general, and the pitfalls that we came across. Hopefully, if you’re planning a move to Kubernetes, this talk could give you a heads up of a couple of gotchas that you’ll probably want to pay attention to before jumping in.
Also great thanks and a shout-out to the wonderful folk from Engineers.SG who recorded and uploaded the talks from GeekcampSG! =)
I recently wanted to unify my dev environments, including my (very handy!) Raspberry Pi 3.
I’d gotten started with it with a Raspbian Jessie, but felt the new Ubuntu 16.04 was really more my speed. Thus began the journey to upgrade Pi OSes
Images
First up, finding the right image. The good thing about the Pi community is that there’s so much activity, and so many community images. The bad thing is, well, that there are so many community images that it’s sometimes hard to tell which is going to work.
It’s a link to a .torrent file from Ubuntu Pi Flavour Maker. You’ll end up with a .img.xz file which you’ll have to unpack (depending on your OS) to get the original .img image.
After which, it’s a quick write to the prepared SD Card (I suggest formatting the card via your OS’s disk management tools, so you’ll want to back anything important up) with something similar to
Once you’re done writing the image to your SD card, pop it into your Pi, connect the peripherals, plug in the power, and… wait.
At this stage, unless you have a configured ethernet connection all set up for your Pi and are confident of SSH’ing in, you’ll probably want a monitor and keyboard attached as well so you can work directly on the console after it boots.
If you don’t have a ready ethernet connection, keep in mind that there’s a script that waits for an address to be assigned to eth0 via DHCP, and times out only after 5 mins. If your Pi isn’t responsive after plugging the power in, grab a coffee or something.
After a while, your Pi should be running, and if you’ve got a monitor connected to it, you should have a login prompt ready to go.
Just in case — the default username and password for RPi Ubuntu images is usually: ubuntu / ubuntu
Connecting to Wifi
The next thing you’ll want to do is probably to connect your Pi to your wifi network. If you don’t, and already have an ethernet connection good to go, then feel free to skip the rest of this section.
Wireless connections on the RPi are handled by a package called wpasupplicant. It’s not installed by default, so you’ll need to grab it with a familiar apt-get install. This is also why you need an ethernet connection to at least get started.
Pro-tip: If your router/switch is too far away from where you have the rest of your RPi set up, bridging your desktop/laptop’s wifi connection over an adapter to an ethernet connection is something I found really handy.
You’ll also notice that if you entered ifconfig at the prompt, the wireless interface wlan0 (by default) has not automatically come up on boot, so we’ll need to configure it to do so.
Find and edit the file /etc/network/interfaces
$ sudo vim /etc/network/interfaces
Then add a block to configure the wlan0 interface with the requisite wifi credentials
Ensure that the interface is properly connected by looking out for the inet addr: 192.168.5.103 line. This means that the RPi is connected and has successfully obtained an IP address on that interface.
To be extra certain, you might want to disconnect the ethernet connection at this stage and reboot the RPi and see if it comes up. Remember the IP address that was issued to wlan0 here, and use that to try to reconnect to the RPi after it reboots. Most routers will issue the same IP via DHCP to the same host if there is no contention, and on a home/small office network, this usually isn’t a problem. This Ubuntu image comes with OpenSSH installed and running, so you’ll just need to attempt to connect via SSH once it boots. Keep in mind that even though the ethernet cable has been disconnected, the script that waits for the ethernet interface to come up still times out at 5 minutes, so you have at least that long to wait.
With that running, you’re good to go!
Resizing the partition
Once your network is up and running rejoice! Until you run a df -h or similar and realise that your partition seems a lot smaller that you thought it’d be.
I’m running my Pi off a 64GB microSD card, but when I first looked, df was showing me only a 3GB drive thereabouts. Talk about a shock!
A quick google revealed that the Ubuntu image didn’t eat up the rest of my 60GB though. Turns out that RPi image is based off of a 4GB disk image, and when I dded that over to my sdcard, it just wrote the exact same partition table as well.
In summary though, when you need to do is to delete the smaller ~4GB partition, and rewrite a larger version back to the partition table.
The mounted sdcard is recognised in the RPi usually as /dev/mmcblk0, with the /boot partition on /dev/mmcblk0p1 and /dev/mmcblk0p2. We’ll need to use fdisk to delete the partition on /dev/mmcblk0p2, and rewrite it back as a larger one.
$ sudo fdisk /dev/mmcblk0
This gets you into fdisk, where you can then print the partition table, and delete partition 2.
Then, create a new primary partition, accepting the defaults fdisk offers, which would be to use all the remaining space on the sdcard. Remember to write the changes to disk before quitting fdisk, otherwise your changes would not take effect.
Once that’s done, reboot the system.
You’ll notice if you run df -h again once the Pi has booted, that it still says your data is sitting on a smaller ~4GB partition. What gives?
Turns out that even though your partition has been resized, the filesystem itself needs to be made aware of its comfy new environment and spread out accordingly.
With a simple
$ resize2fs /dev/mmcblk0p2
the filesystem is resized, and df -h should finally show you the values you’ve been expecting all along.
Conclusion
Once all this is done, your RPi should be up and ready to use! Happy hacking!