Monitoring of a Kubernetes Cluster from the Outside with Prometheus
Sat, Aug 26, 2017When setting up a Kubernetes cluster, a Prometheus and Grafana setup is a great way to have to start monitoring your cluster health. From CPU and RAM stats, to filesystem usage, to even the number and type of requests that your cluster is serving. One thing however, is that most setups tend to assume that you’ll be deploying Prometheus within the cluster itself. To be sure, this is probably the easier way of settings things up. Within the cluster, your Prometheus set up will have no issues finding and monitoring the configured pods, endpoints and nodes.
The Problem with an out-cluster Prometheus setup
That said, sometimes, it’s not entirely feasible to deploy Prometheus within a particular cluster — for example, if you wanted Prometheus to monitor mulitple Kubernetes clusters across multiple service providers like AWS and Azure.
In this scenario, I’ve found it more convenient to host Prometheus separately, outside the Kubernetes clusters, then set it up to monitor the clusters and their services and pods.
However, I ran into yet another problem, which was properly exposing the services to have them scaped by Prometheus — particularly in the case of Deployments that spanned more than one Pod. While I could potentially include sidecar containers in each Pod exposing /metrics on a given port, I struggled to find a way to properly expose them to an out-cluster Prometheus. I could expose an Ingress and have Prometheus access the endpoint through the cluster’s main IP, but given as how Kubernetes Services deliver requests to their backing Pods in a round-robin fashion, this meant that each successive scrape could end up hitting a different pod. This would lead to confusing metrics to say the least. Ideally, what we would want is for Prometheus to be able to distinguish between the metrics scraped from each individual pod (with a different label for each pod), that way, we could tell if, say, one Pod ended up serving more traffic than the others in the Deployment.
One option to address each Pod individually would perhaps be to expose one Ingress per Pod. Of course, this would have to be automated in some form, perhaps having yet another Service watch new pods being spun up and creating the necessary exporters and Ingresses automatically, but this approach quickly gets very unwieldy, without even considering what happens once we start scaling in any form.
So now we have two problems. We want to
- have Prometheus be able to access the metrics endpoints for all necessary pods, without the need to have to define them beforehand,
- and do so from outside the cluster, without having to manually (or otherwise) open up Ingresses
Abusing the API Server
As it turns out, the APIServer does in fact allow us to communicate directly with the Pods, without necessarily creating an Ingress, or a Service beforehand. All that’s needed is the proper credentials and authorisation to make HTTP requests through the APIServer.
It’s not terribly obvious from the outset, but even the very familiar kubectl does in fact communicate with the APIServer (and manages the cluster) via simple HTTP calls. (Run any kubectl command with the -v 10 option to see the HTTP calls that are being made in the background — eg. kubectl -v 10 version)
Access Control
In order to communicate with the APIServer through its API though, we’ll first need to set up some form of access control.
If you’re on Kubernetes < 1.6, you’ll have to use Attributed-based Access Control (ABAC), and if you’re running Kubernetes > 1.6, you’ll be able to use the more convenient Role-based Access Control (RBAC). A discussion on how to effectively use ABAC vs RBAC is beyond the scope of this post, but essentially, you’ll want to end up with an access token (eg. a ServiceAccount’s Secret token value) that will allow you to make authenticated and authorised requests to the APIServer.
If you’d just like to try it out, you could run kubectl -v 10 version, watch the HTTP calls, and simply use the values kubectl is sending in the Authorization HTTP header. For production setups however, I’d recommend setting up a proper ServiceAccount with appropriately scoped permissions.
Accessing Pods through the APIServer
It’s not commonly mentioned in the general Kubernetes documentation, but APIServer does allow you to make rquests directly to the pods within the cluster.
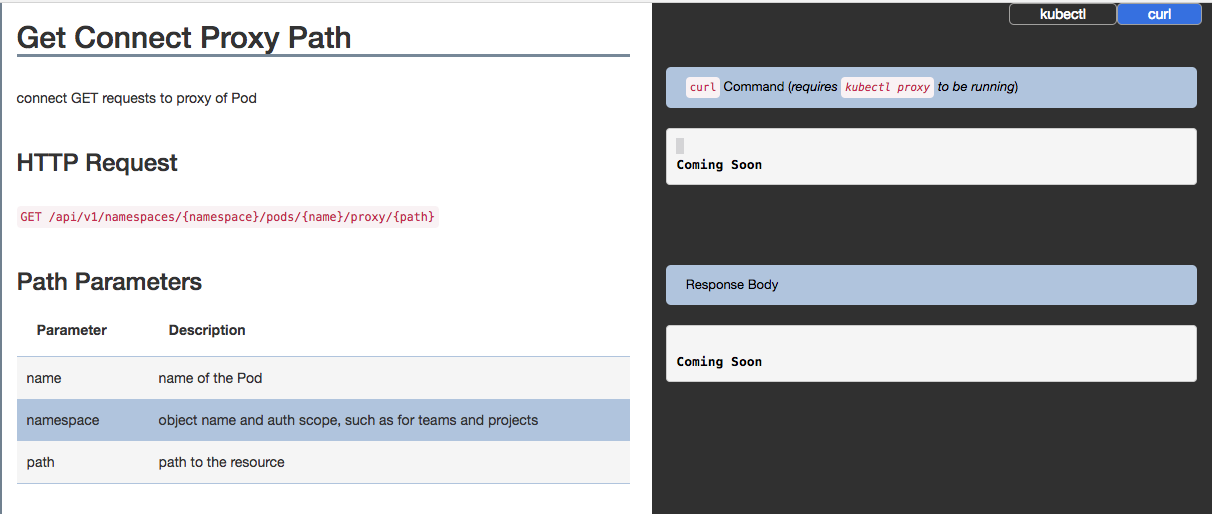
Get Connect Proxy Path
It's hardly clear what you're supposed to do with this, and the lack of documented examples don't help either
However, with the handy documentation on this page, we can make HTTP calls directly to each pod, through the Kubernetes API server, without needing to create a specific Ingress for each Pod that we’d like to have Prometheus scrape. It follows that this means that we can afford to then expose metrics pages only on cluster-local IP addresses, without worry of those pages leaking out to the public Internet.
From the Kubernetes API documentation, we can refer to the sections on Proxy operations for the various Kubernetes objects. For example, the Pod proxy operations show us how to reach out to a specific Pod through the Kubernetes API.
Assuming we have a Prometheus exporter pod, prom-exporter in the namespace monitoring, that exposes metrics at the path /metrics, that we’d like to scrape.
The general pattern of the request looks like
GET /api/v1/proxy/namespaces/{namespace}/pods/{name}/{path}
We can make a request to the Pod via the call below
GET /api/v1/proxy/namespaces/monitoring/pods/prom-exporter/metrics
#
# As a curl command, it should look something like
#
# $ curl "https://<api_server:port>/api/v1/proxy/namespaces/monitoring/pods/prom-exporter/metrics
which should give us our exported metrics.
Security
Naturally, when you’re setting up Prometheus to perform scraping through the proxy API in this manner, you’ll want to be connecting over HTTPS to ensure that your metrics are not leaked to third parties over the wire. However though, since Kubernetes APIServer SSL certs are usually self signed, you’ll also want to include your APIServer’s CA certificate in your Prometheus configuration so that you can authenticate the server.
In your prometheus.yml,
    ...
    - job_name: 'natsd'
      scheme: https
      bearer_token: "$KUBERNETES_TOKEN"
      tls_config:
        ca_file: /etc/prometheus/tls/certs/kubernetes.crt

      kubernetes_sd_configs:
      - api_server: 'host.kubernetes.apiserver.com'
        bearer_token: "$KUBERNETES_TOKEN"
        tls_config:
          ca_file: /etc/prometheus/tls/certs/kubernetes.crt
        role: pod
    ...
Extracting the CA certificate from the APIServer is a matter of running (assuming the APIServer is running at 192.168.1.10),
$ openssl s_client -connect 192.168.1.10:6443 < /dev/null | openssl x509 -text
<... truncated ...>
    Signature Algorithm: sha256WithRSAEncryption
     73:2b:6e:46:d7:16:10:e8:f3:31:ba:56:a7:3a:e7:23:b2:2a:
     78:27:4e:4d:0e:a8:de:46:29:e7:14:60:99:e2:50:00:d7:2b:
     de:87:e1:a5:25:3a:14:fa:6e:41:82:dc:4f:9c:5c:83:7e:4e:
     5d:94:46:4b:10:7a:19:83:4e:fc:4d:71:ee:38:51:e0:1f:61:
     57:64:54:34:42:77:bd:7b:eb:61:b7:de:e7:60:82:c1:e6:1f:
     b5:47:bd:94:a0:a1:cf:cd:fd:ac:b4:63:9c:55:16:a5:2f:d3:
     c9:63:dd:ba:c5:38:30:9d:62:0b:e8:d3:b8:38:ea:08:67:4d:
     f3:2e:57:d7:fc:74:7d:16:9d:5f:a9:9d:d8:71:5a:de:70:ed:
     ac:04:ad:92:03:ac:2d:0f:f6:a8:6f:63:56:77:5d:7b:5e:b3:
     d1:a1:b8:09:34:fe:12:23:18:50:a7:dd:85:2f:ae:00:49:e4:
     e9:6d:6d:9c:d1:52:e6:2f:16:89:6b:05:e7:46:8c:b0:b5:84:
     38:e1:8a:06:82:4c:8a:05:bf:e7:38:53:45:a3:73:bd:bc:67:
     05:c3:ec:4a:65:d1:c9:d1:08:a2:6d:11:e2:c2:81:78:81:16:
     0c:b6:57:4f:82:e6:02:77:4e:9a:e6:99:bc:ad:bd:08:2a:8d:
     c0:9d:40:3c
-----BEGIN CERTIFICATE-----
MIIDbzCCAlegAwIBAgIIF8beimuBxWAwDQYJKoZIhvcNAQELBQAwFTETMBEGA1UE
AxMKa3ViZXJuZXRlczAeFw0xNzEyMDQwNjEyMDNaFw0xODEyMDQwNjEyMDNaMBkx
FzAVBgNVBAMTDmt1YmUtYXBpc2VydmVyMIIBIjANBgkqhkiG9w0BAQEFAAOCAQ8A
MIIBCgKCAQEApovuAK4JmvuHqoV4FUHJveXZryKoqn/g8ej8DZYqRKDV8uAFnbIk
2OQcKR3nfeK4N5PihS8ecbSOiwJbWGUNCPj4WLmlFCOz1/s5Zt3vpIfSlX34eYR8
ubWCEuk+dsXKZOYn/ZZK+Ev/gpf9GA2HjTLz43FBJnyLd3o4reltsh+/qgDCFK0k
u3PoagHbCNWOLXGx8rIHHU3DOMf2r9pYagjHveSr42Fpa89OhpA91s/YsBuN3Ab8
cCHHM/Ui5IG6jxLkQ+vBqBWTPoGEQ82tK4e/e9XwJGKH2zcHwEJRVbGsipcL88eT
0NZjvFD3UoVhA27eV6lfPW3MGkn8RAnKsQIDAQABo4G+MIG7MA4GA1UdDwEB/wQE
AwIFoDATBgNVHSUEDDAKBggrBgEFBQcDATCBkwYDVR0RBIGLMIGIggprdWJlbWFz
dGVyggprdWJlcm5ldGVzghJrdWJlcm5ldGVzLmRlZmF1bHSCFmt1YmVybmV0ZXMu
ZGVmYXVsdC5zdmOCJGt1YmVybmV0ZXMuZGVmYXVsdC5zdmMuY2x1c3Rlci5sb2Nh
bIIKa3ViZY1hc3RlcocEwKgBCocECmAAAYcEwKgBCjANBgkqhkiG9w0BAQsFAAOC
AQEAcytuRtcWEOjzMbpWpzrnI7IqeCdOTQ6o3kYp5xRgmeJQANcr3ofhpSU6FPpu
QYLcT5xcg35OXZRGSxB6GYNO/E1x7jhR4B9hV2RUNEJ3vXvrYbfe52CCweYftUe9
lKChz839rLRjnFUWpS/TyWPdusU4MJ1iC+jTuDjqCGdN8y5X1/x0fRadX6md2HFa
3nDtrAStkgOsLQ/2qG9jVndde16z0aG4CTT+EiMYUKfdhS+uAEnk6W1tnNFS5i8W
iWsF50aMsLWEOOGKBoJMigW/5zhTRaNzvbxnBcPsSmXRydEIom0R4sKBeIEWDLZX
T4LmAndOiuaZvK29CCqNwJ1APA==
-----END CERTIFICATE-----
The important bit is between the BEGIN CERTIFICATE and END CERTIFICATE lines, inclusive. Save that to a file named ca.crt (for example), and include it in your prometheus.yml.
Putting it together
Eventually, our configuration ends up looking something like this
    ...
    - job_name: 'natsd'
      scheme: https
      bearer_token: "$KUBERNETES_TOKEN"
      tls_config:
        ca_file: /etc/prometheus/tls/certs/kubernetes.crt

      kubernetes_sd_configs:
      - api_server: 'host.kubernetes.apiserver.com'
        bearer_token: "$KUBERNETES_TOKEN"
        tls_config:
          ca_file: /etc/prometheus/tls/certs/kubernetes.crt
        role: pod

      # Tells Prometheus to query the APIServer for all pods matching the target label (natsd-*) below
      # and for each of the pods, generate a scrape target at the `/metrics` path via the proxy API
      relabel_configs:
      - source_labels: [__meta_kubernetes_namespace, __meta_kubernetes_pod_name, __meta_kubernetes_pod_container_port_name]
        action: keep
        regex: default;natsd-.*;metrics  # Remember to use the right 'container_port_name` as specified in the Deployment
      - target_label: __address__
        replacement: 'host.kubernetes.apiserver.com'  # API server address
      - source_labels: [__meta_kubernetes_namespace, __meta_kubernetes_pod_name,__meta_kubernetes_pod_container_port_number]
        regex: (.+);(.+);(.+)
        target_label: __metrics_path__
        replacement: /api/v1/namespaces/${1}/pods/http:${2}:${3}/proxy/metrics  # Path after /proxy/ is metrics path of pod
      - action: labelmap
        regex: __meta_kubernetes_pod_label_(service|tier|type)
      - source_labels: [__meta_kubernetes_namespace]
        action: replace
        target_label: namespace
      - source_labels: [__meta_kubernetes_pod_name]
        action: replace
        target_label: pod_name
    ...
With this, we can expose metrics on each individual natsd-* pod within the Kubernetes cluster, without needing to worry about setting up an Ingress nor a Service for the sole purpose of allowing an off-cluster Prometheus setup to access said metrics.